Visualizing Data for Classification
In this lab, we’ll explore the German bank credit dataset to understand relationships for a classification problem. Unlike regression problems where the label is a continuous variable, classification problems involve categorical labels. We aim to visually explore the data to identify features useful in predicting customers with bad credit.
Load and Prepare the Dataset
Let’s start by loading the necessary packages and the dataset. The dataset contains information about bank customers, including both numeric and categorical features. The goal is to predict whether a customer has bad credit or not.
import pandas as pd
import matplotlib.pyplot as plt
import seaborn as sns
import numpy as np
import numpy.random as nr
import math

%matplotlib inline

credit = pd.read_csv('German_Credit.csv', header=None)
credit.columns = ['customer_id', 'checking_account_status', 'loan_duration_mo', 'credit_history',
                   'purpose', 'loan_amount', 'savings_account_balance', 'time_employed_yrs',
                   'payment_pcnt_income','gender_status', 'other_signators', 'time_in_residence',
                   'property', 'age_yrs', 'other_credit_outstanding', 'home_ownership',
                   'number_loans', 'job_category', 'dependents', 'telephone', 'foreign_worker',
                   'bad_credit']

credit.drop(['customer_id'], axis=1, inplace=True)
Now, we have 21 columns, including 20 features and the label column (‘bad_credit’). Let’s proceed by recoding the categorical features for better understanding.
# Recoding categorical features
code_list = [['checking_account_status', {'A11': '< 0 DM', 'A12': '0 - 200 DM', ... }],
             ['credit_history', {'A30': 'no credit - paid', 'A31': 'all loans at bank paid', ... }],
             ...]

for col_dic in code_list:
    col = col_dic[0]
    dic = col_dic[1]
    credit[col] = [dic[x] for x in credit[col]]
Now, the categorical features have more human-readable codes.
Examine Classes and Class Imbalance
Before visualizing, let’s check for class imbalance in the label (‘bad_credit’).
credit_counts = credit['bad_credit'].value_counts() print(credit_counts)There are 710 cases with good credit and 302 cases with bad credit, indicating some class imbalance.
Visualize Class Separation by Numeric Features
We’ll visualize the separation quality of numeric features using box plots.
num_cols = ['loan_duration_mo', 'loan_amount', 'payment_pcnt_income', 'age_yrs', 'number_loans', 'dependents']
plot_box(credit, num_cols)
Interpretation:
- Features like loan_duration_mo, loan_amount, and payment_pcnt_income show useful separation between good and bad credit customers.
- On the other hand, age_yrs, number_loans, and dependents seem less useful for separation.
We can also use violin plots for a different perspective.
plot_violin(credit, num_cols)
Visualize Class Separation by Categorical Features
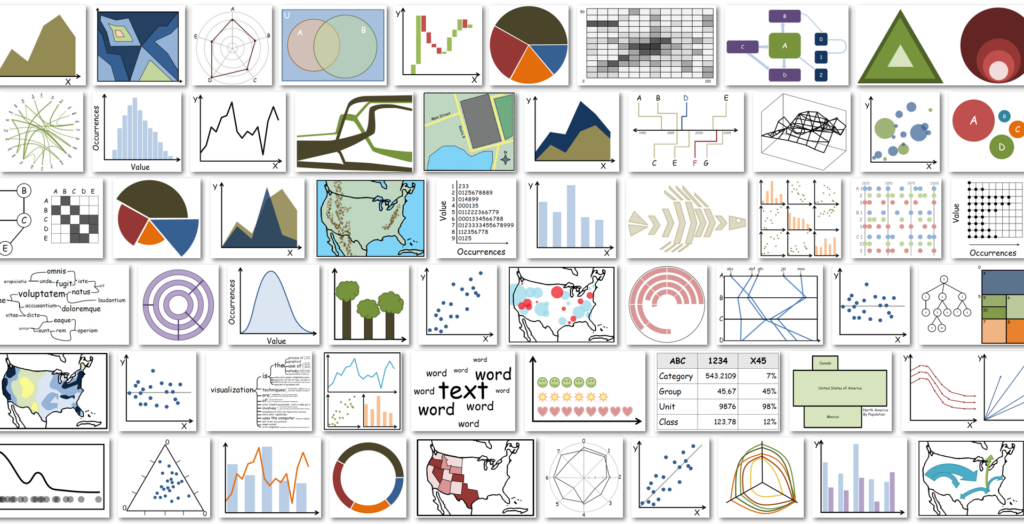
Now, we’ll visualize the ability of categorical features to separate classes using bar plots.
cat_cols = ['checking_account_status', 'credit_history', 'purpose', 'savings_account_balance',
            'time_employed_yrs', 'gender_status', 'other_signators', 'property',
            'other_credit_outstanding', 'home_ownership', 'job_category', 'telephone',
            'foreign_worker']

credit['dummy'] = np.ones(shape=credit.shape[0])
for col in cat_cols:
    plot_categorical_feature(credit, col)
Interpretation:
- Some features like checking_account_status and credit_history have significantly different distributions between good and bad credit customers.
- Others like gender_status and telephone show small differences that might not be significant.
- Features with a dominant category, such as other_signators, foreign_worker, home_ownership, and job_category, may have limited power for separation.
Summary
In this lab, we explored and visualized a classification dataset, examining class imbalance, and identifying numeric and categorical features useful for class separation. Understanding these relationships is crucial for building effective classification models.

